Your PostgreSQL database looks perfect on paper. Your queries look correct. Your indexes look fine.
Yet your database is still very slow — and you have no idea what’s going on inside it.
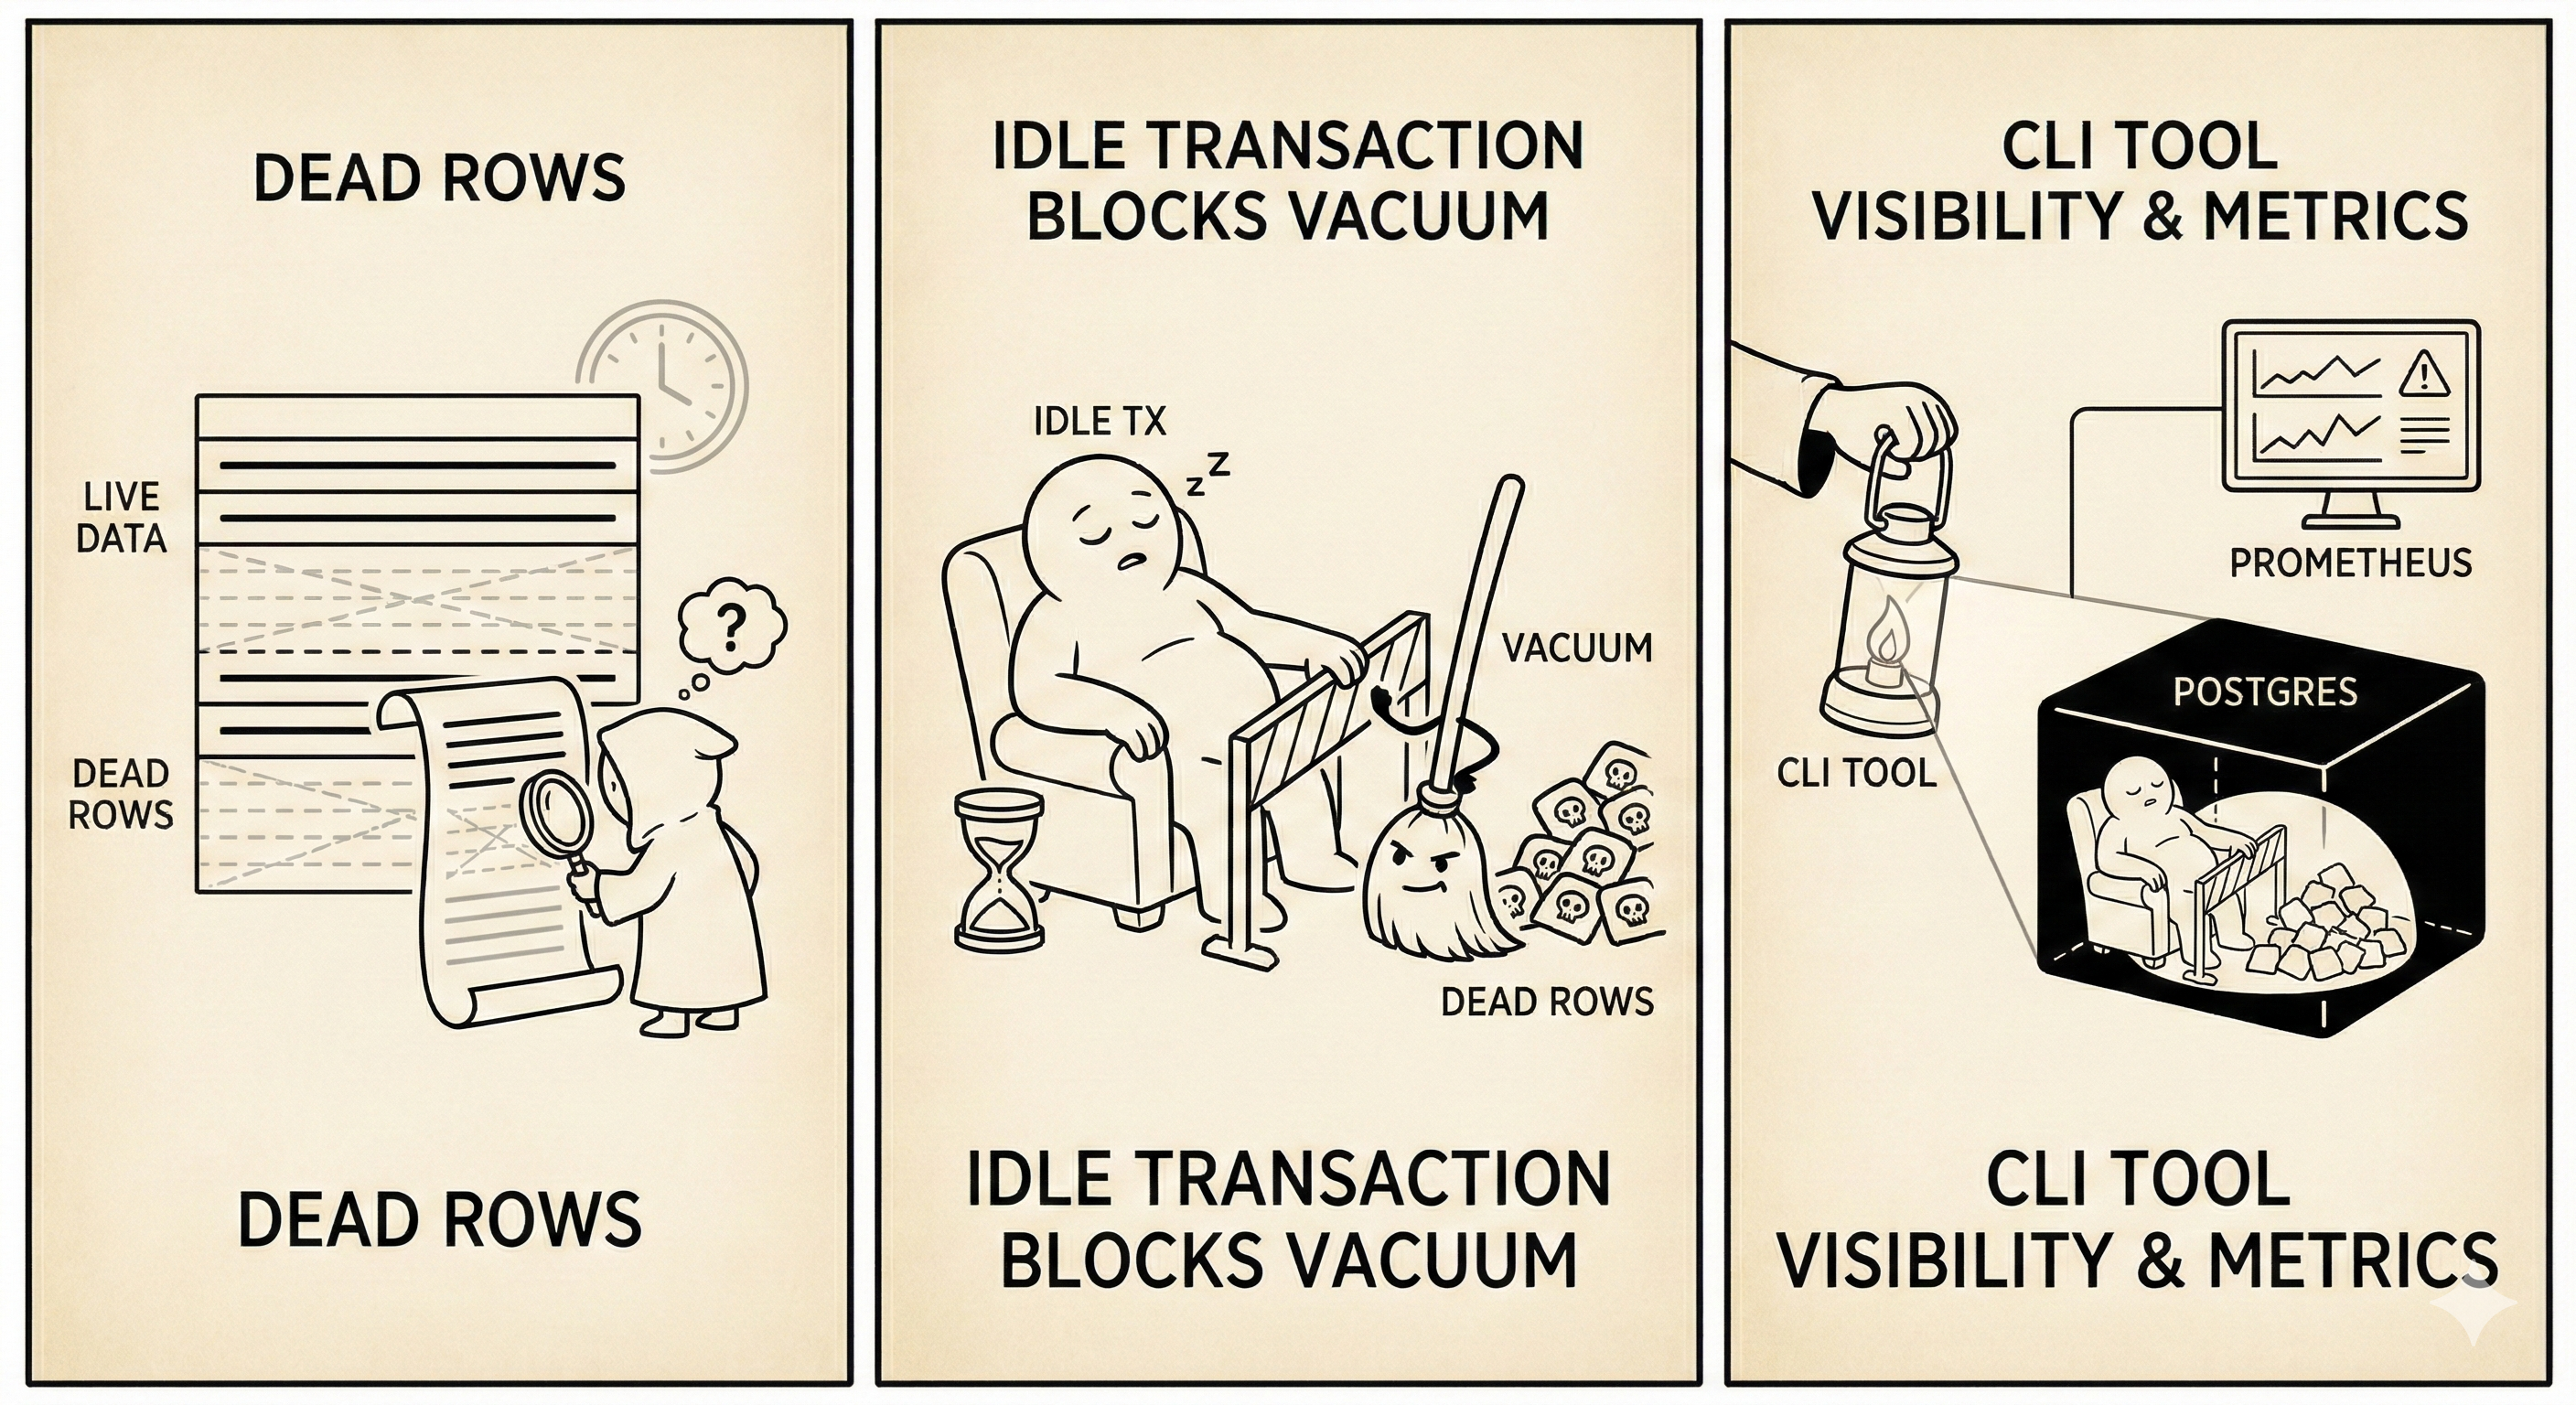
This is a very common situation. Most of the time, the problem isn’t your query or your code, but something happening silently inside PostgreSQL. There are several things that can cause this, but in this article I’ll focus on dead rows and idle transactions, because they are some of the most misunderstood and most common causes.
This project was built to make those problems visible.
What are dead rows?
A dead row is a version of a row that is no longer visible to any active transaction. It’s basically stale (expired) data waiting to be cleaned up by PostgreSQL’s VACUUM. We get dead rows when we run queries like UPDATE and DELETE.
In PostgreSQL, when you run an UPDATE or DELETE, the database does not immediately erase the data. Instead, PostgreSQL keeps the old version of the row and marks it as dead, while creating a new row version (in the case of UPDATE). This is how PostgreSQL works internally, and it’s part of its design.
So when do dead rows become a problem?
Dead rows are normal — that’s just how PostgreSQL works. However, they become a problem when they are not cleaned up fast enough.
For example, if you have a table with 1 million live rows and 9 million dead rows, PostgreSQL still has to read table pages that contain both live and dead rows when scanning data. Even though dead rows are not returned in query results, they still take up space on disk and increase the amount of data PostgreSQL needs to read. This leads to more disk I/O and slower queries, especially as indexes also start to bloat.
At this point, you might think you’ve been doing something wrong by not clearing dead rows yourself — but you haven’t. This cleanup is normally handled automatically by PostgreSQL using VACUUM, not by the developer.
What is VACUUM and why it exists
VACUUM scans tables, finds dead rows, and marks their space as available for future rows to reuse. This allows PostgreSQL to keep table sizes under control and maintain good performance.
There is more to how VACUUM works, but the key thing to understand is that it runs in the background and usually does its job without anyone noticing — until something prevents it from doing so.
So why do some dead rows escape VACUUM and don’t get cleaned?
This is where idle transactions come in.
If you BEGIN a transaction and forget to COMMIT or ROLLBACK, that transaction is still considered active. As long as PostgreSQL believes a transaction might still need to see old versions of rows, VACUUM is not allowed to remove those dead rows.
Because of this, dead rows start to pile up even though autovacuum is running. The problem is not that VACUUM is broken — it’s doing exactly what it’s designed to do.
Why do most people miss this?
Database issues like this are usually invisible to normal application monitoring. Your app metrics might show that queries are slow, but they won’t tell you why they are slow. They won’t say whether the issue is caused by dead rows, locks, long-running transactions, or blocked VACUUM.
ORMs make this worse because transaction handling is often hidden. You might not even realize that a transaction is being kept open, especially in background jobs or poorly configured connection pools.
How this project helps
This is exactly why I built this project.
The tool is a simple CLI that checks for:
- dead rows (dead tuples) per table
- idle transactions that can block VACUUM
- blocked queries caused by locks
Instead of guessing why PostgreSQL feels slow, the CLI gives you direct visibility into what’s actually happening inside the database.
Detecting Dead Rows
The first thing we need to check is how many dead tuples exist in each table. PostgreSQL tracks this in the pg_stat_user_tables view:
SELECT
    schemaname,
    relname AS table_name,
    n_live_tup AS live_rows,
    n_dead_tup AS dead_rows,
    last_vacuum,
    last_autovacuum
FROM pg_stat_user_tables
WHERE n_dead_tup > 0
ORDER BY n_dead_tup DESC;
This query returns all tables with dead rows, sorted by the count. If you see a table with millions of dead rows compared to live rows, that’s a red flag.
In Go, we can wrap this in a reusable function:
type DeadRowStats struct {
    Schema        string
    TableName     string
    LiveRows      int64
    DeadRows      int64
    LastVacuum    sql.NullTime
    LastAutoVacuum sql.NullTime
}

func (c *Checker) GetDeadRows(threshold int64) ([]DeadRowStats, error) {
    query := `
        SELECT schemaname, relname, n_live_tup, n_dead_tup,
               last_vacuum, last_autovacuum
        FROM pg_stat_user_tables
        WHERE n_dead_tup > $1
        ORDER BY n_dead_tup DESC`

    rows, err := c.db.Query(query, threshold)
    if err != nil {
        return nil, fmt.Errorf("failed to query dead rows: %w", err)
    }
    defer rows.Close()

    var results []DeadRowStats
    for rows.Next() {
        var stat DeadRowStats
        err := rows.Scan(
            &stat.Schema, &stat.TableName,
            &stat.LiveRows, &stat.DeadRows,
            &stat.LastVacuum, &stat.LastAutoVacuum,
        )
        if err != nil {
            return nil, err
        }
        results = append(results, stat)
    }
    return results, nil
}
The threshold parameter allows filtering — you might only care about tables with more than 10,000 dead rows.
Detecting Zombie Transactions
Zombie transactions are connections stuck in “idle in transaction” state. They hold locks and prevent VACUUM from doing its job:
SELECT
    pid,
    usename,
    state,
    query,
    age(clock_timestamp(), xact_start) AS transaction_age,
    xact_start
FROM pg_stat_activity
WHERE state = 'idle in transaction'
  AND xact_start IS NOT NULL
ORDER BY xact_start ASC;
This shows all connections that started a transaction but never committed or rolled back. The transaction_age column tells you how long the transaction has been open.
type ZombieTransaction struct {
    PID            int
    Username       string
    State          string
    Query          string
    TransactionAge string
    StartTime      time.Time
}

func (c *Checker) GetZombieTransactions() ([]ZombieTransaction, error) {
    query := `
        SELECT pid, usename, state, query,
               age(clock_timestamp(), xact_start)::text,
               xact_start
        FROM pg_stat_activity
        WHERE state = 'idle in transaction'
          AND xact_start IS NOT NULL
        ORDER BY xact_start ASC`

    rows, err := c.db.Query(query)
    if err != nil {
        return nil, fmt.Errorf("failed to query zombie transactions: %w", err)
    }
    defer rows.Close()

    var results []ZombieTransaction
    for rows.Next() {
        var zt ZombieTransaction
        err := rows.Scan(
            &zt.PID, &zt.Username, &zt.State,
            &zt.Query, &zt.TransactionAge, &zt.StartTime,
        )
        if err != nil {
            return nil, err
        }
        results = append(results, zt)
    }
    return results, nil
}
If you find transactions that have been idle for hours, something is wrong in your application code.
Detecting Blocked Queries
Blocked queries are queries waiting on locks held by other processes. This is one of the most frustrating issues to debug without proper tooling:
SELECT
    blocked.pid AS blocked_pid,
    blocked.usename AS blocked_user,
    blocked.query AS blocked_query,
    blocking.pid AS blocking_pid,
    blocking.usename AS blocking_user,
    blocking.query AS blocking_query,
    age(clock_timestamp(), blocked.query_start) AS wait_duration
FROM pg_stat_activity blocked
JOIN pg_locks blocked_locks ON blocked.pid = blocked_locks.pid
JOIN pg_locks blocking_locks ON blocked_locks.locktype = blocking_locks.locktype
    AND blocked_locks.database IS NOT DISTINCT FROM blocking_locks.database
    AND blocked_locks.relation IS NOT DISTINCT FROM blocking_locks.relation
    AND blocked_locks.pid != blocking_locks.pid
JOIN pg_stat_activity blocking ON blocking_locks.pid = blocking.pid
WHERE NOT blocked_locks.granted
  AND blocking_locks.granted;
This query joins pg_stat_activity with pg_locks to find which queries are blocked and which queries are blocking them. The wait_duration tells you how long the blocked query has been waiting.
Putting It All Together
The CLI ties everything together with simple commands:
# Check for blocked queries
./pginspect blocked

# Check for zombie transactions
./pginspect zombie

# Check for dead rows exceeding a threshold
./pginspect dead --threshold 10000
Each command exits with status code 1 if issues are found, making it easy to integrate with monitoring systems.
Because it’s a CLI, it can be run as a cron job to periodically check database health. From there, the results can be exported as metrics and pushed into systems like Prometheus, where you can create alerts for things like:
- too many dead rows on a table
- long-running idle transactions
- blocked queries lasting too long
This way, you catch problems early — before they turn into performance incidents.