I built an event analytics backend to track user interactions (clicks, views, scrolls) in real time. What started as a simple CRUD API evolved into a system capable of processing 73 million events per day on a single machine.
This blog walks you through the mistakes I made, how I fixed them, and how I optimized the system.
Tech Stack: Go, PostgreSQL, Redis Streams, Docker, Kubernetes
I wanted to build a backend system that:
- Accepts event data (user_id, action, element, timestamp)
- Stores events for analytics
- Handles high throughput without blocking users
- Maintains data integrity
Sounds simple, right? That’s what I thought—until scalability became a problem.
Let’s go through the mistakes I made and how I fixed them.
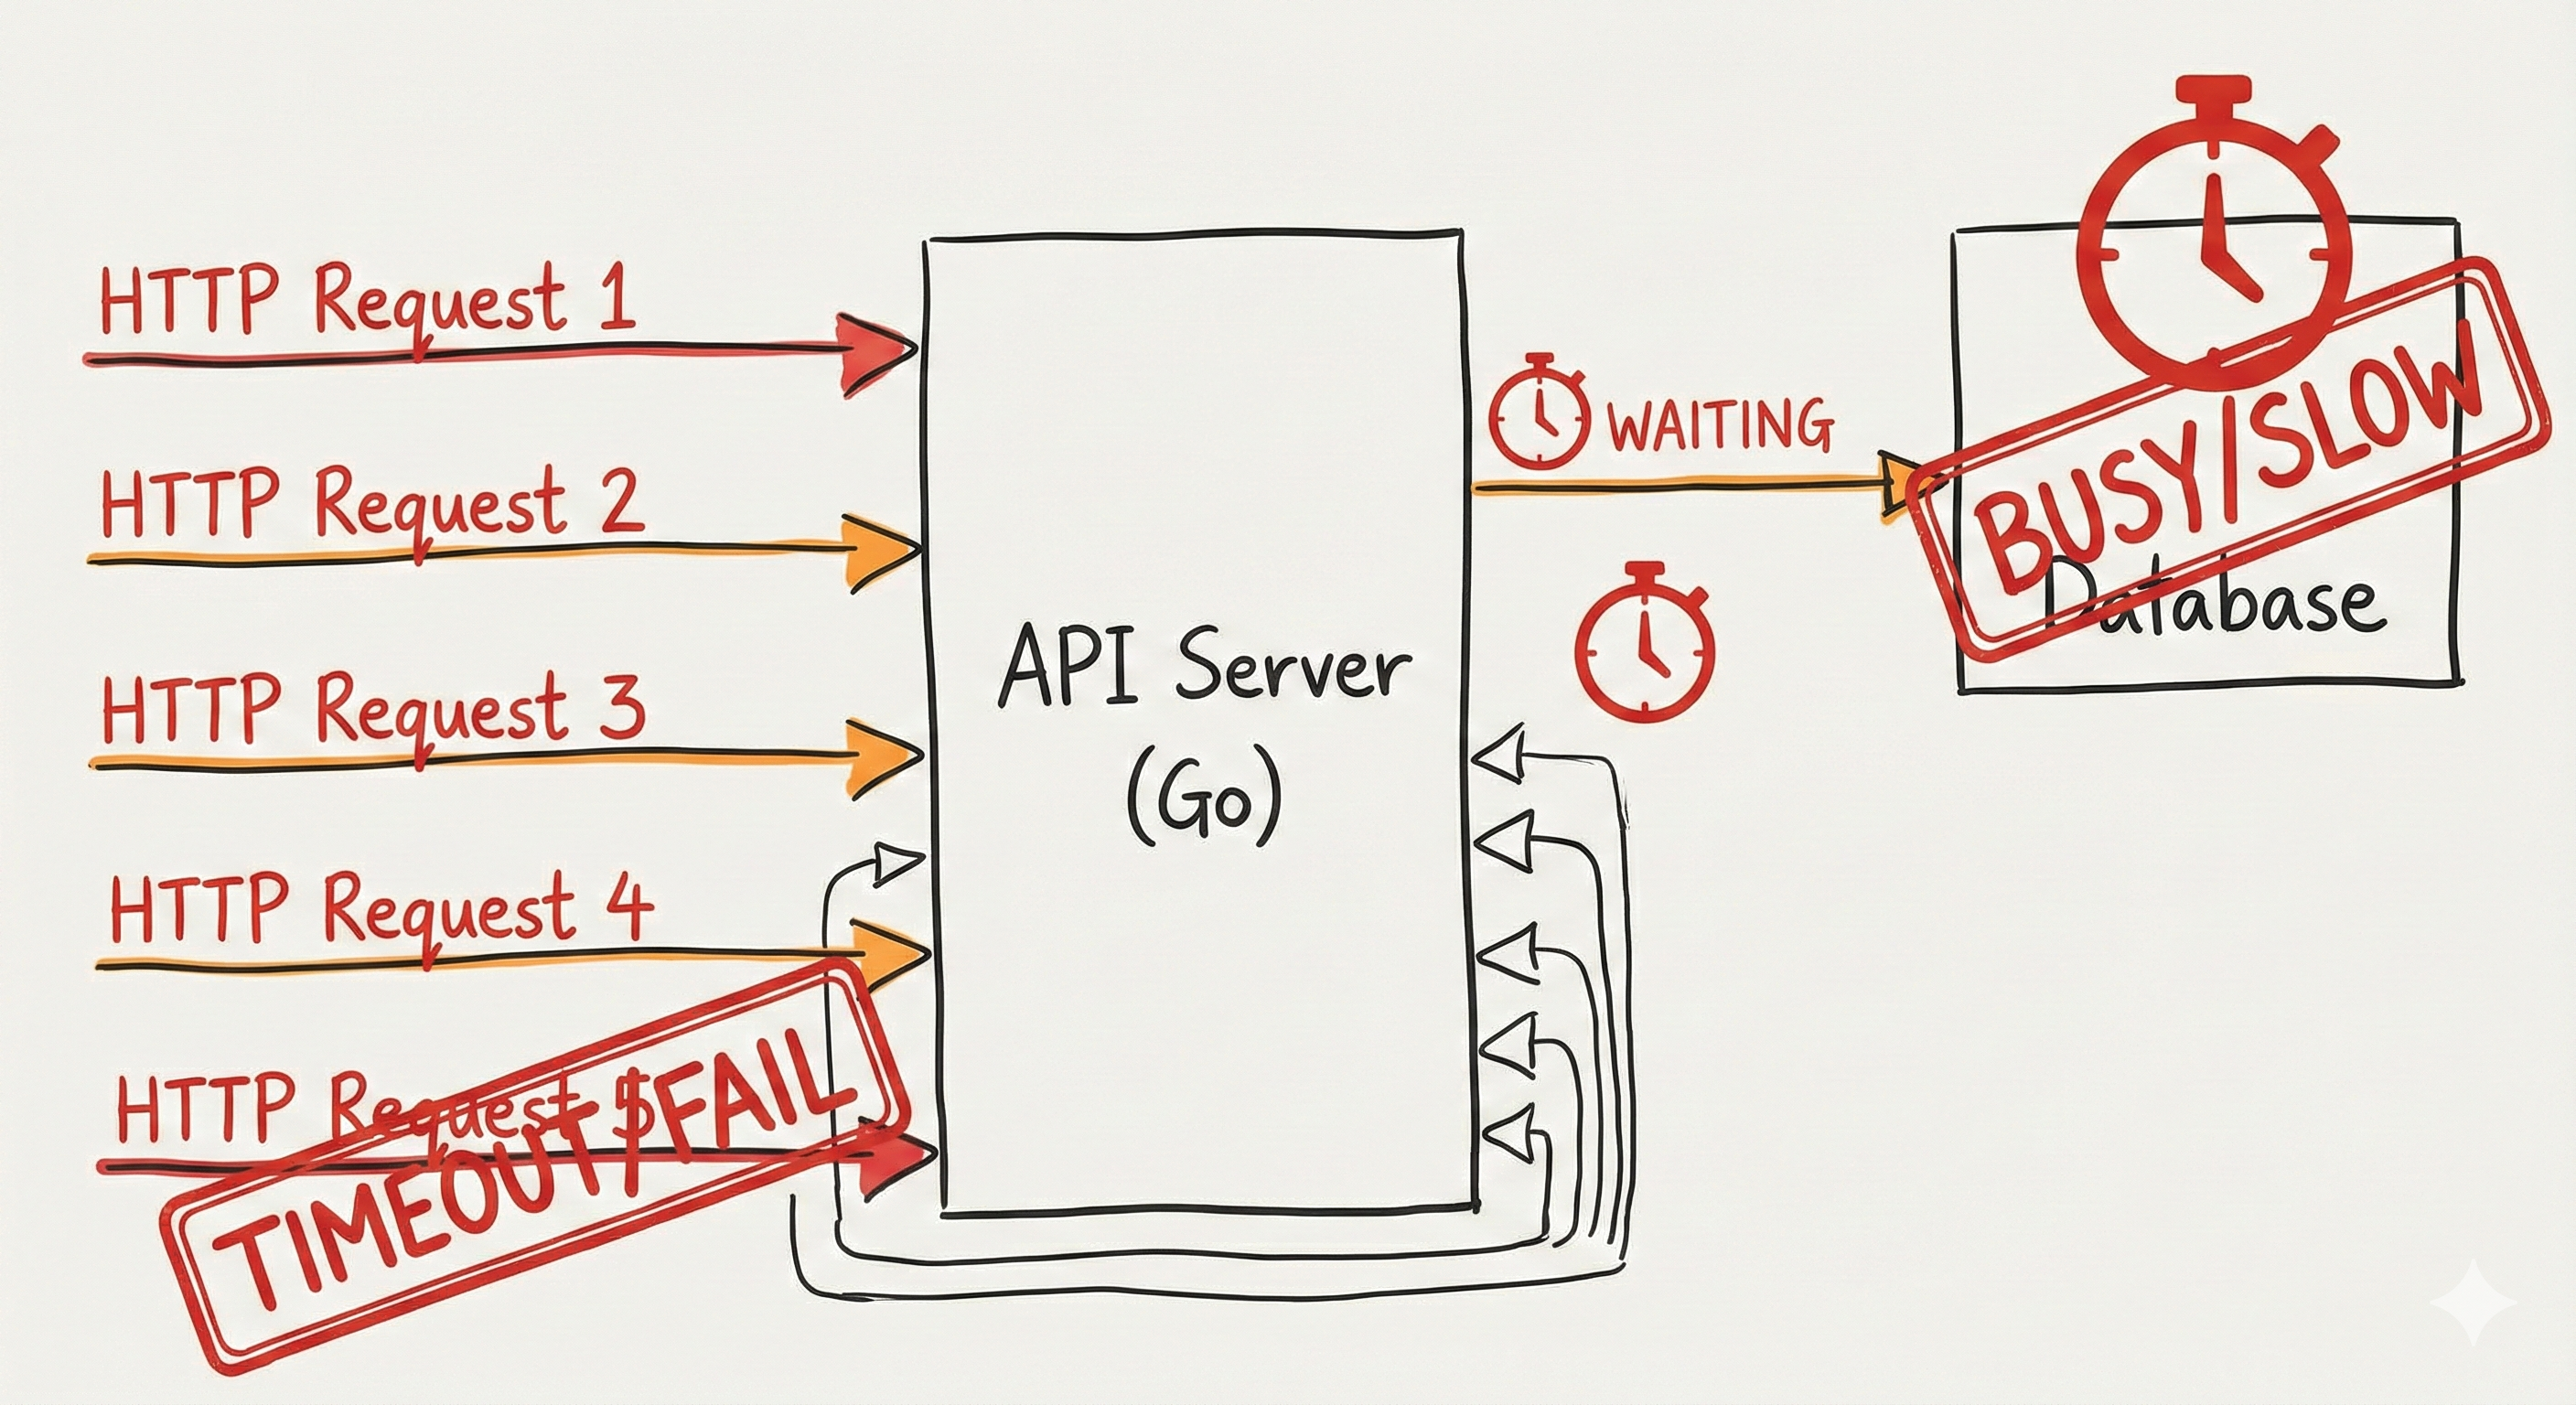
Mistake 1: Synchronous, Blocking Architecture
The Problem
Every HTTP request waited for the database write to finish. Under load, this caused cascading failures:
Request 1 → DB (50ms) Request 2 → DB (50ms) Request 3 → DB busy (200ms) Request 4 → DB overwhelmed (1000ms) Request 5 → Timeout → FAIL
func GetEvent(c *gin.Context) {
var event models.Event
c.ShouldBind(&event)
// Write directly to database
database.AddToDatabase(event)
c.JSON(200, gin.H{"event": event})
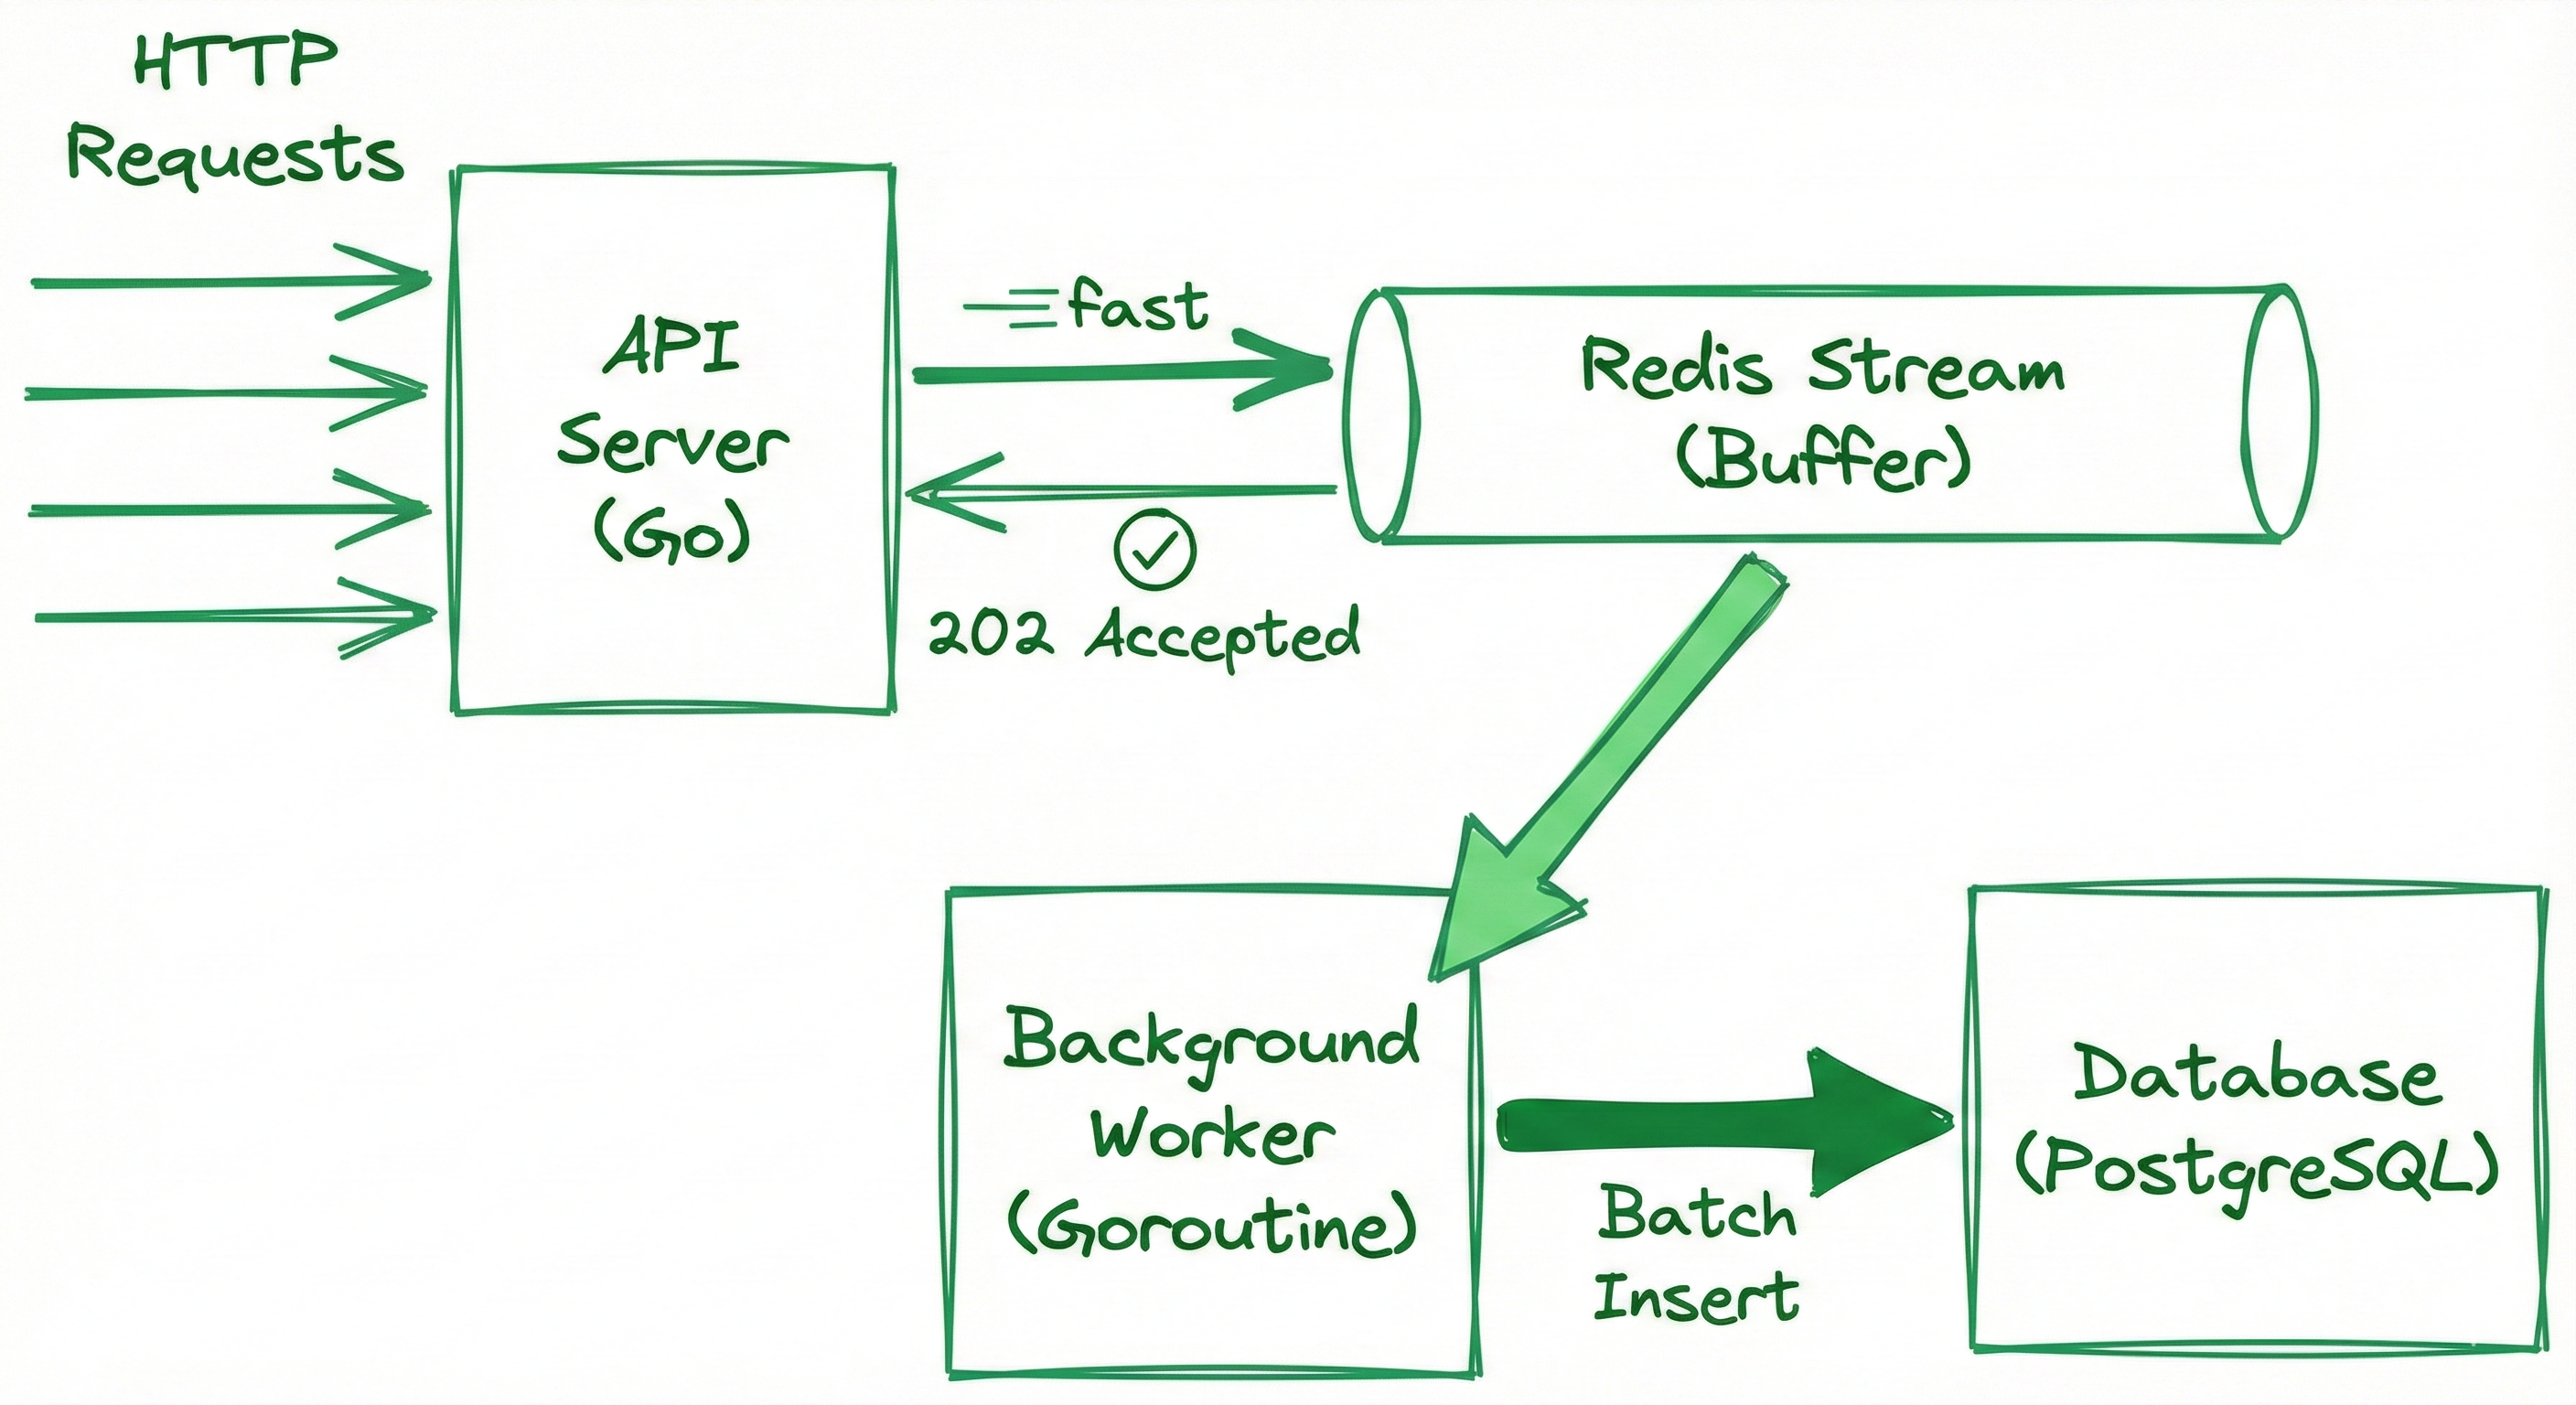
}Fix 1: Asynchronous Processing Using Redis Streams
The API doesn’t need to wait for the database. Users only need confirmation that the event was received.
I chose Redis Streams because:
- It’s lightweight and fast
- It keeps message history
- It guarantees delivery
- It’s easy to work with
- It’s RAM-based, so it’s much faster than Kafka
Kafka stores more data, but I didn’t need long-term retention—I needed speed. Redis Streams fit the use case perfectly.
// Handler (fast path)
func GetEvent(c *gin.Context) {
    var event models.Event
    c.ShouldBind(&event)

    // Write to Redis Stream
    database.AddToStream(event)

    // Return immediately
    c.JSON(202, gin.H{"status": "accepted"})
}

// Background Worker
func StartWorker() {
    for {
        events := database.ReadFromGroup()     // Read in batches
        database.BatchAddToDatabase(events)     // Single transaction
        database.AckMessage(events)
        time.Sleep(100 * time.Millisecond)
    }
}
Why This Works
- Non-blocking API — returns in 5–10ms regardless of DB load
- Batch processing — 100 inserts in one transaction (10–50x faster)
- Decoupled layers — API and DB operate independently
Initial Stats
| Load Level | Requests | Concurrency | Throughput | Avg Latency | Failures |
|---|---|---|---|---|---|
| Light | 1,000 | 10 | 207 req/s | 46ms | 0% |
| Medium | 5,000 | 50 | 93 req/s | 524ms | 0% |
| Heavy | 10,000 | 100 | 88 req/s | 1.1s | 0% |
| Extreme | 20,000 | 200 | 60 req/s | 3.2s | 0.7% |
Daily Capacity: ~17.8M events
Mistake 2: Misusing Redis Streams
Since it was my first time using Redis Streams, I did something inefficient: I wrote to Redis, then immediately read from Redis in the same request. This removed the benefit of async processing.
Request → Redis Write (5ms) → Redis Read (10ms) → DB Write (500ms)
Total: ~515ms (slower than before)
The Fix
Move the worker to a completely separate goroutine:
func main() {
    database.InitRedis()
    database.InitDB()

    go worker.StartWorker()

    router.Run(":8080")
}
Results After True Asynchronous Processing
| Load Level | Requests | Concurrency | Throughput | Avg Latency | P99 | Failures |
|---|---|---|---|---|---|---|
| Light | 1,000 | 10 | 840 req/s | 11ms | 56ms | 0% |
| Medium | 5,000 | 50 | 961 req/s | 51ms | 114ms | 0% |
| Heavy | 10,000 | 100 | 753 req/s | 132ms | 349ms | 2.7% |
| Extreme | 20,000 | 200 | 60 req/s | 3.2s | 10.3s | 99.9% |
Daily Capacity: ~73 million events/day
Mistake 3: Not Optimizing Database Operations
Even though the system was fast, the database was constantly under pressure.
Why? 100 events = 100 separate INSERTs → 100 transactions.
Fix: Batch Inserts
One batch insert reduces overhead and improves database health.
Second Optimization: Event Aggregation
Storing every single event leads to:
- Massive tables
- Slow queries
- High storage cost
Example: 1,000 users click the same button → 1,000 rows.
Solution: Time-Window Aggregation
Before:
5 clicks at slightly different timestamps → 5 rows
After:
Group them by a 5–10 second window:
aggregated_events:
{action: "click", element: "button", count: 5, window: "14:00:00"}
user_event_maps:
Links each user to the aggregated row
This reduces redundant event storage by 90%+.
Final Results
| Version | Architecture | Throughput | Latency | Daily Capacity | Improvement |
|---|---|---|---|---|---|
| V1: Sync | Direct DB writes | 207 req/s | 46ms | 17.8M | Baseline |
| V2: Async (Wrong) | Redis + read-back | 93 req/s | 524ms | 8M | Worse |
| V3: Async (Correct) | Redis + Worker | 840 req/s | 11ms | 73M | 4x better |
| V4: + Aggregation | Window grouping | 850 req/s | 11ms | 73M | Same speed, 90% less DB load |
Key Metrics (Single Optimized Server)
- Peak Throughput: 961 req/s
- Sustained Average: 850 req/s
- Avg Latency: 11ms
- P99 Latency: 56ms
- Daily Capacity: 73,440,000 events
- Failure Rate: 0% under normal load
Lessons Learned
-
Architecture > Tools Redis didn’t speed things up until I used it the right way.
-
Measure Everything Load testing exposes bottlenecks you won’t see in normal use.
-
Know Your Bottlenecks First bottleneck: synchronous DB writes After fix: DB connection pool Final bottleneck: hardware limits Optimizing the wrong layer wastes effort.
-
Batch Operations Are Extremely Powerful One transaction with 100 events is 10–50x faster than 100 individual transactions.
-
Local Testing Isn’t Realistic My single machine handled 850 req/s. Production hardware could easily handle 10x more.